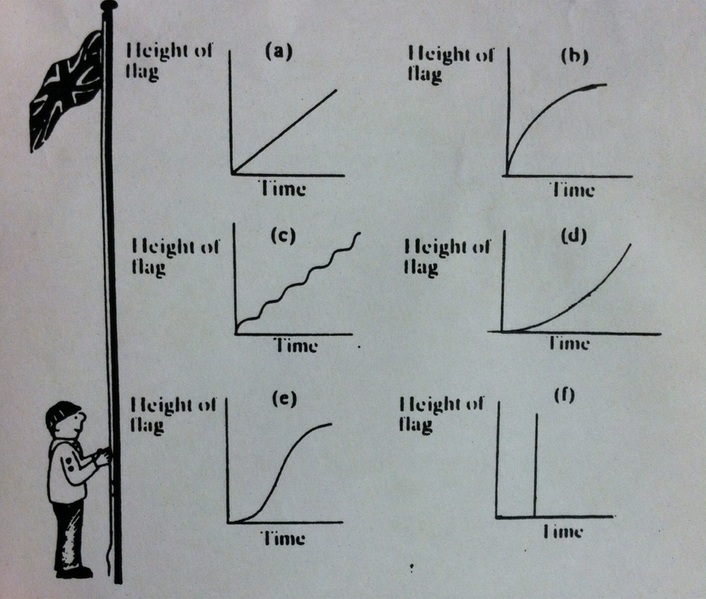
In the picture shown below graph A would mean that over time the flag was raised steadily and at the same speed till it reached the top of the pole. In graph B the flag was raised very fast at first but at the end they slowed down and it took longer to get the flag to the top. In graph C the flag was raised very fast and then stopped being raised all together and then started up again multiple times till it finally was fully raised. In graph D the flag was raised slowly at first but after awhile the person sped up, it was all continuous and never completely stopped. In graph E the flag was raised slowly at first then sped up and rose quickly then slowed back down once the flag was almost at the top. In graph F the flag was raised immediately and it took no time at all for the flag to reach the top.
The graph shown that is the most realistic would be graph A because it is a steady line that shows over time the flag is raised to its full height without every stopping or pausing. The least realistic would be graph F because it is basically saying that the flag was raised to its full height immediately and without time passing, when in reality it would take awhile to raise it.
The graph shown that is the most realistic would be graph A because it is a steady line that shows over time the flag is raised to its full height without every stopping or pausing. The least realistic would be graph F because it is basically saying that the flag was raised to its full height immediately and without time passing, when in reality it would take awhile to raise it.
 RSS Feed
